Audio Spectrum Visualizer
Northwestern EE 202, Fall 2022
View code on GitHub ↗︎- Embedded Systems
- Analog Design
- Signal Processing
- Hardware Debugging
- Circuit Prototyping
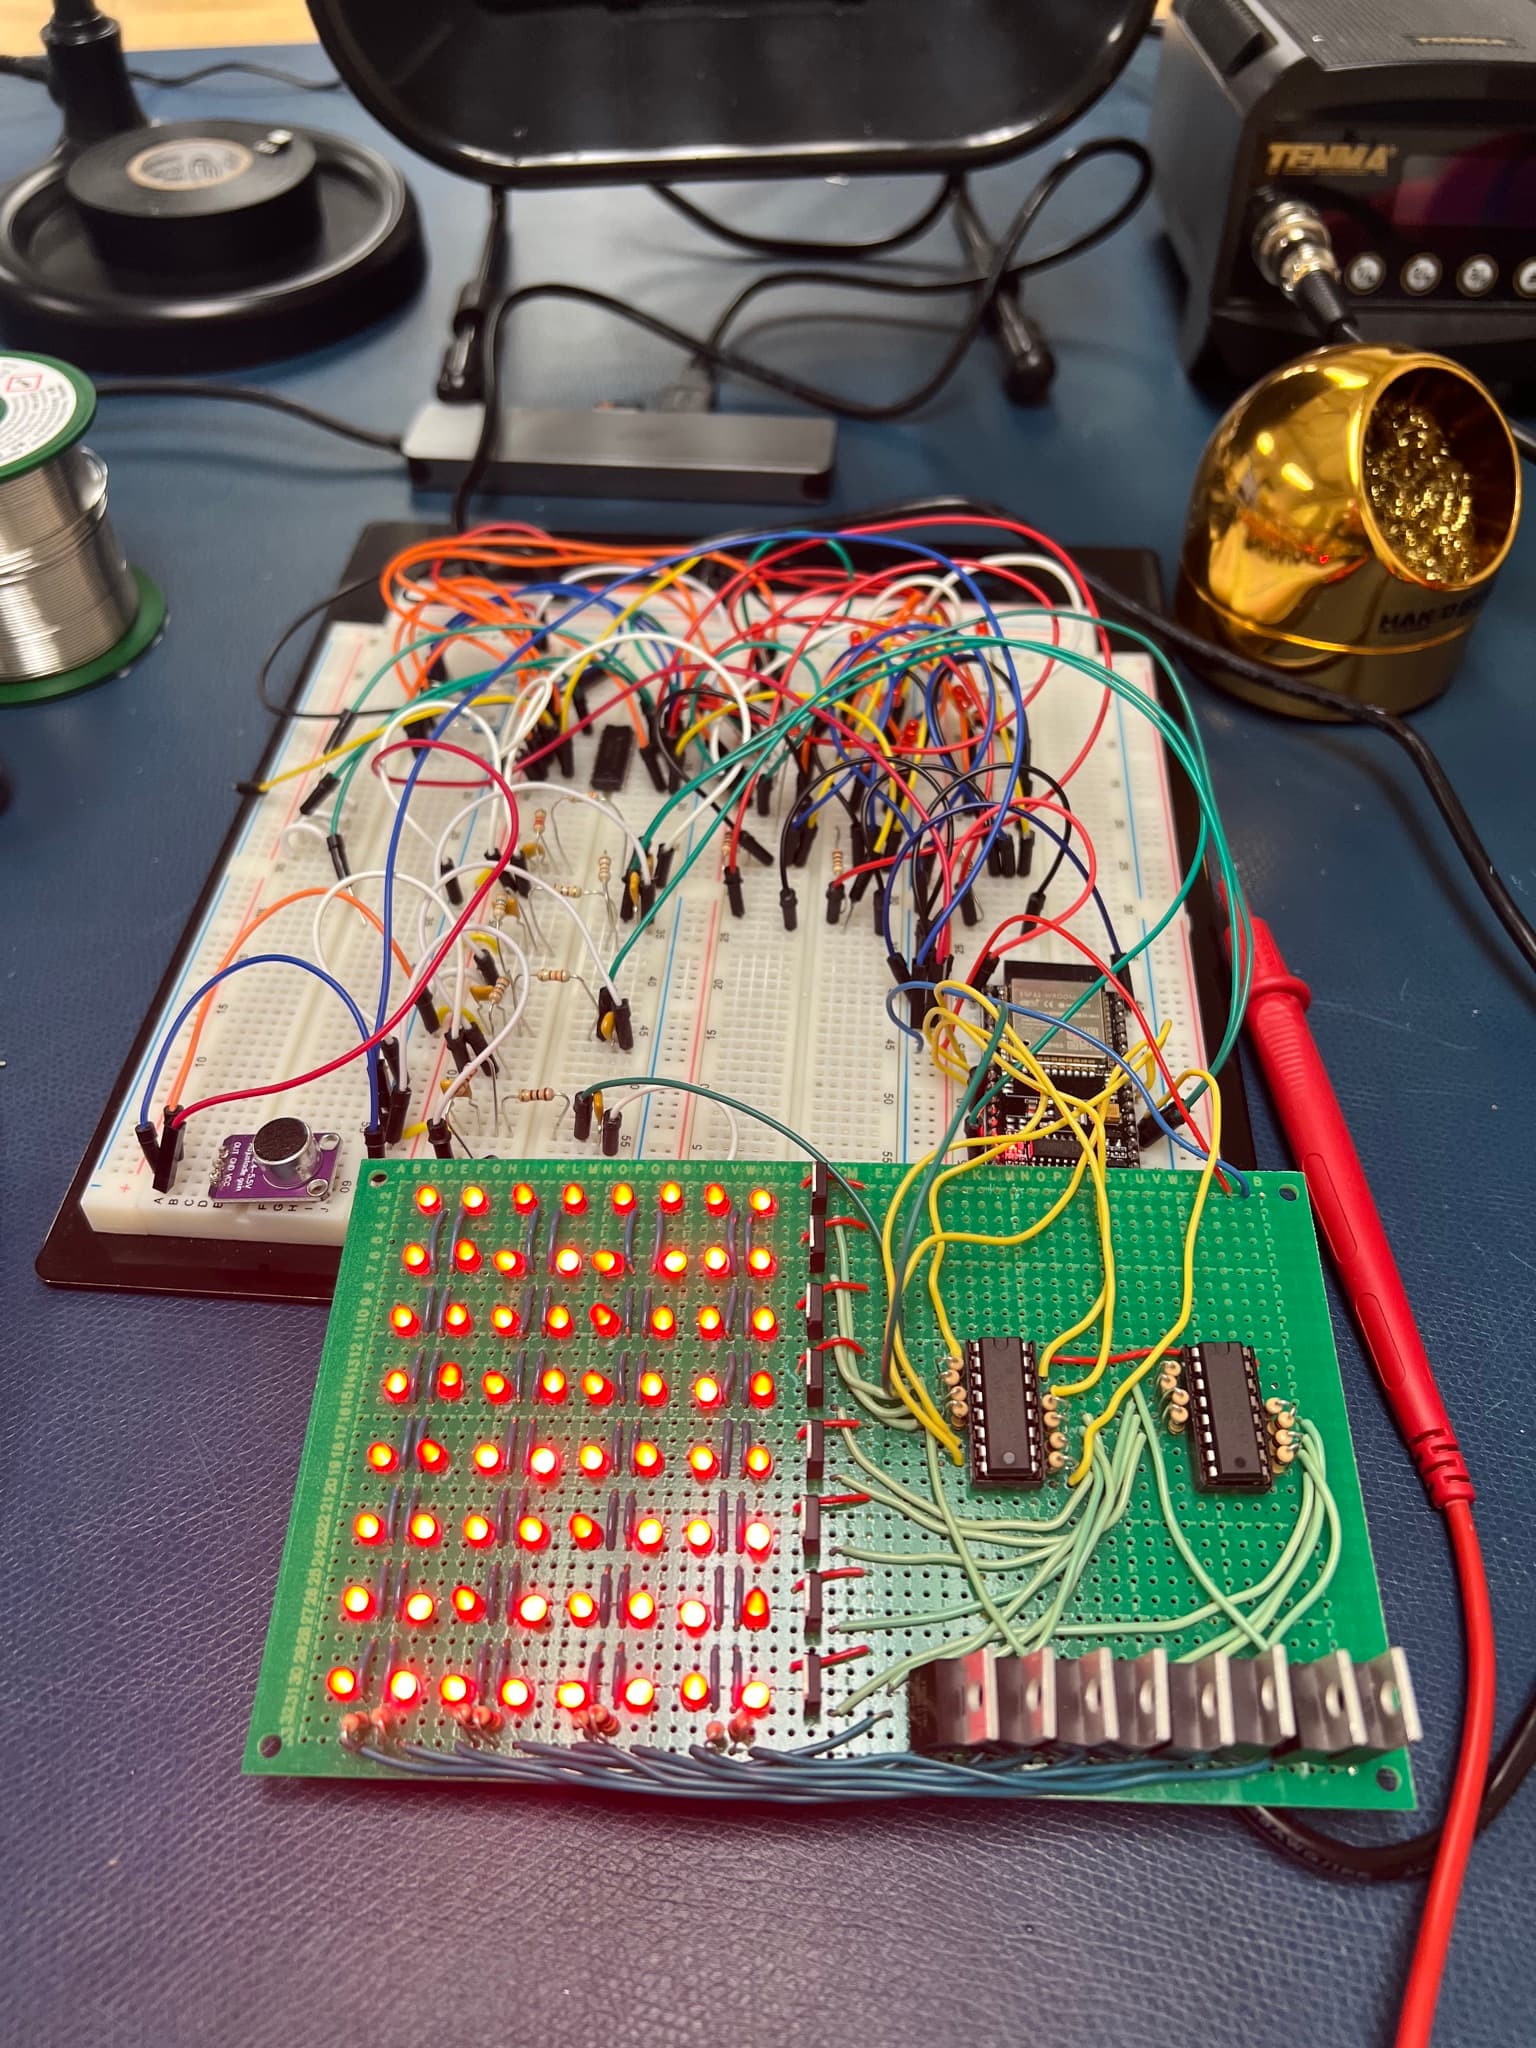
The problem
A two-part lab building a real-time audio spectrum visualizer: take a microphone's raw audio signal, split it into four frequency bands using only passive analog filters, and display the result live on an 8x8 LED matrix.
Design constraints and requirements
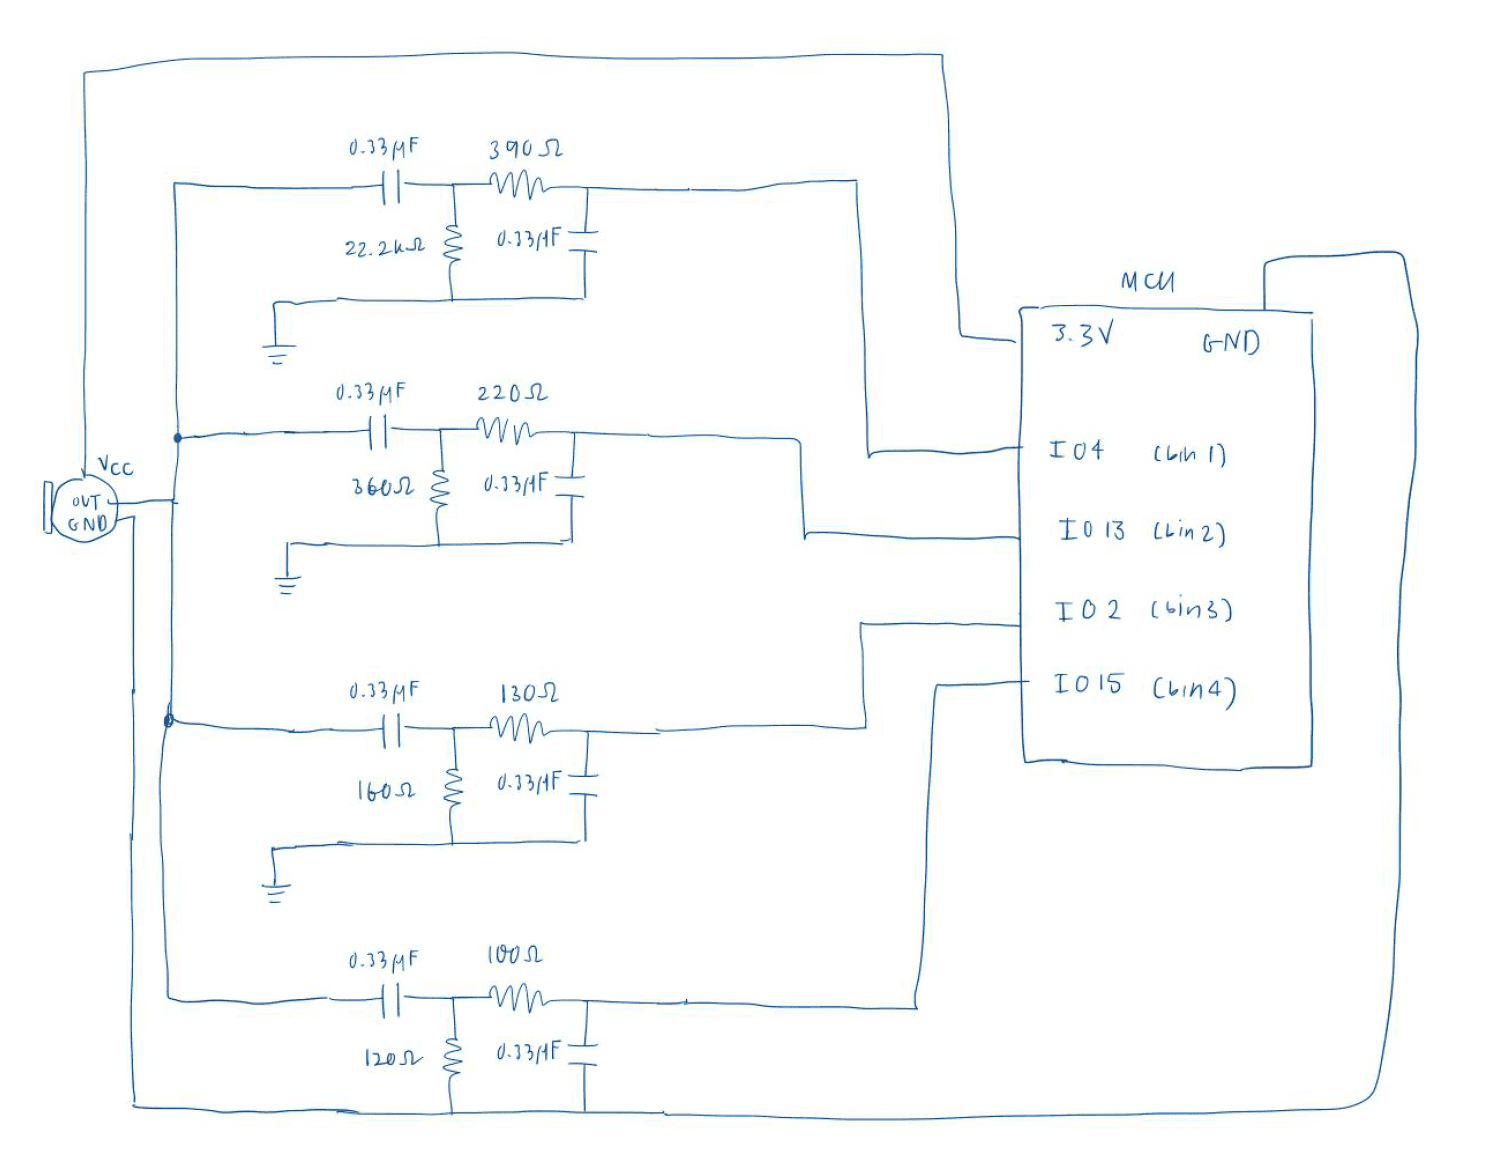
The filter design had to use passive RC filters with the same capacitor value (0.33 µF) for every stage. With capacitance fixed, the four frequency bands were created by choosing different resistor values. Each band-pass filter combined a high-pass and low-pass filter to divide 20 Hz to 5 kHz audio into four bins.
System architecture
Analog front end — a microphone signal was split into four RC band-pass filters. Each filter's resistor pair was solved from the first-order cutoff relationship (f = 1/2πRC):
- Band 1: ~22–1206 Hz
- Band 2: ~1270–2411 Hz
- Band 3: ~2679–3710 Hz
- Band 4: ~4020–4823 Hz
The actual frequency ranges were then measured and verified using real audio signals.
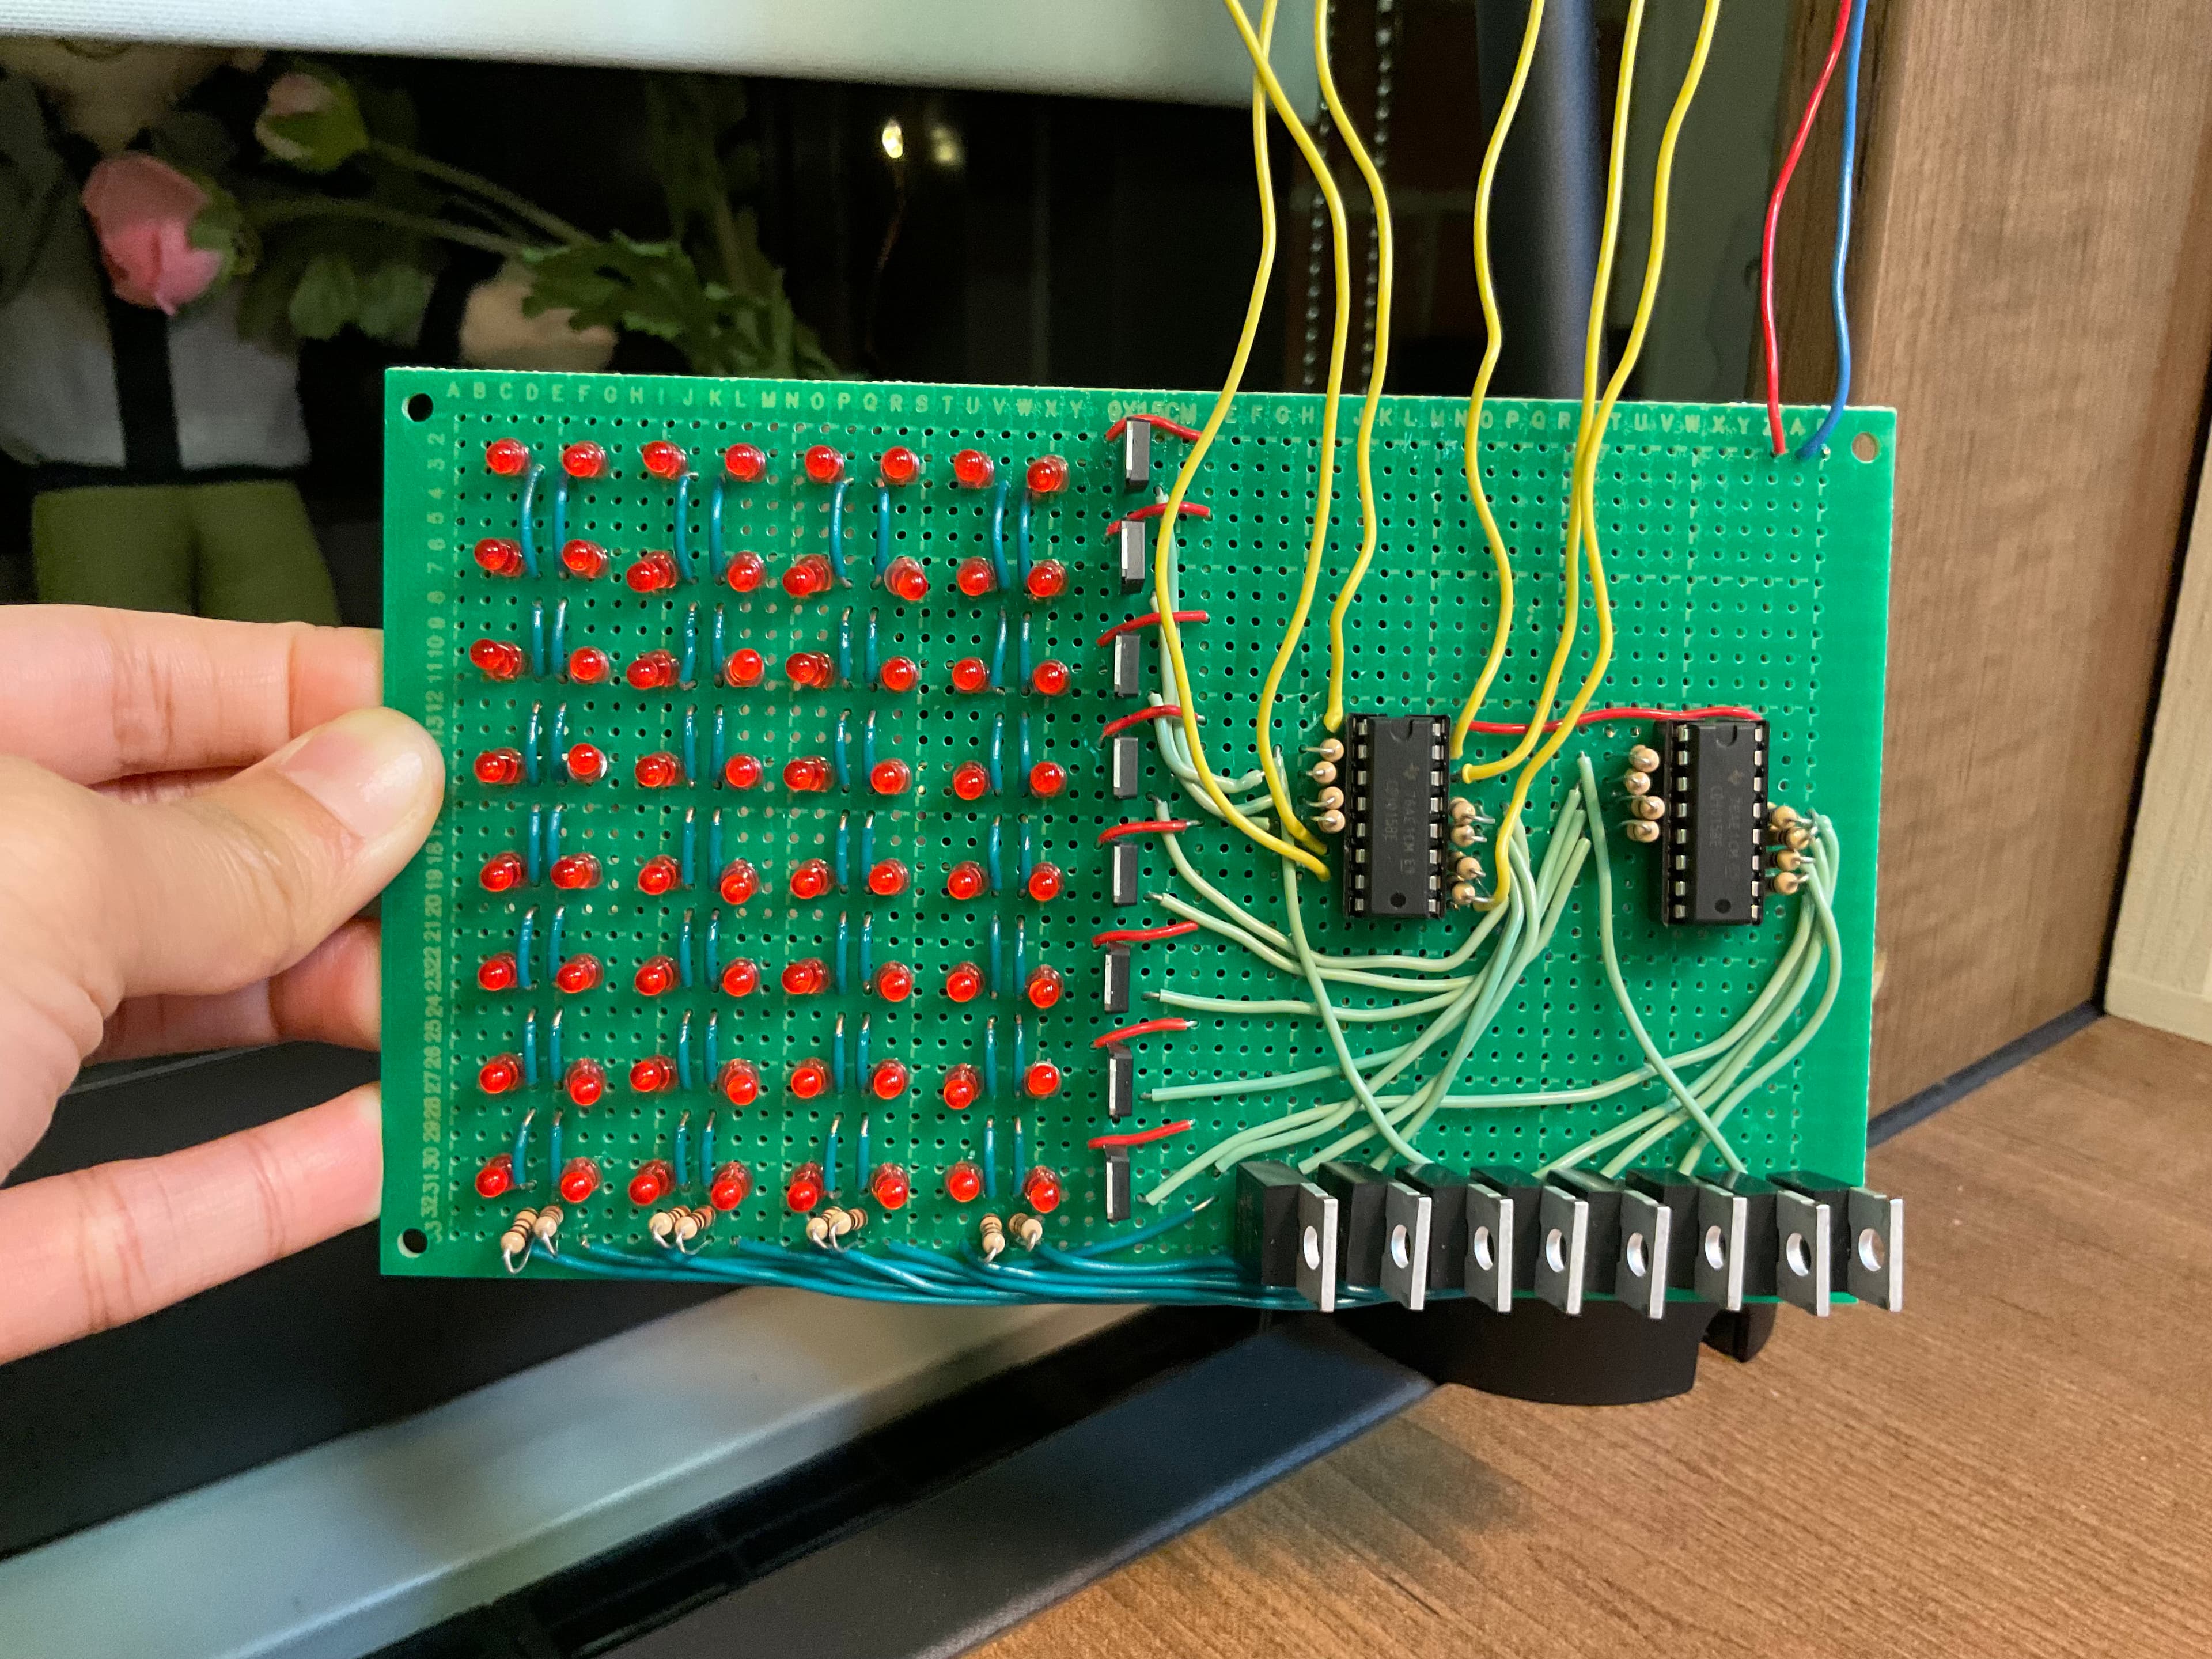
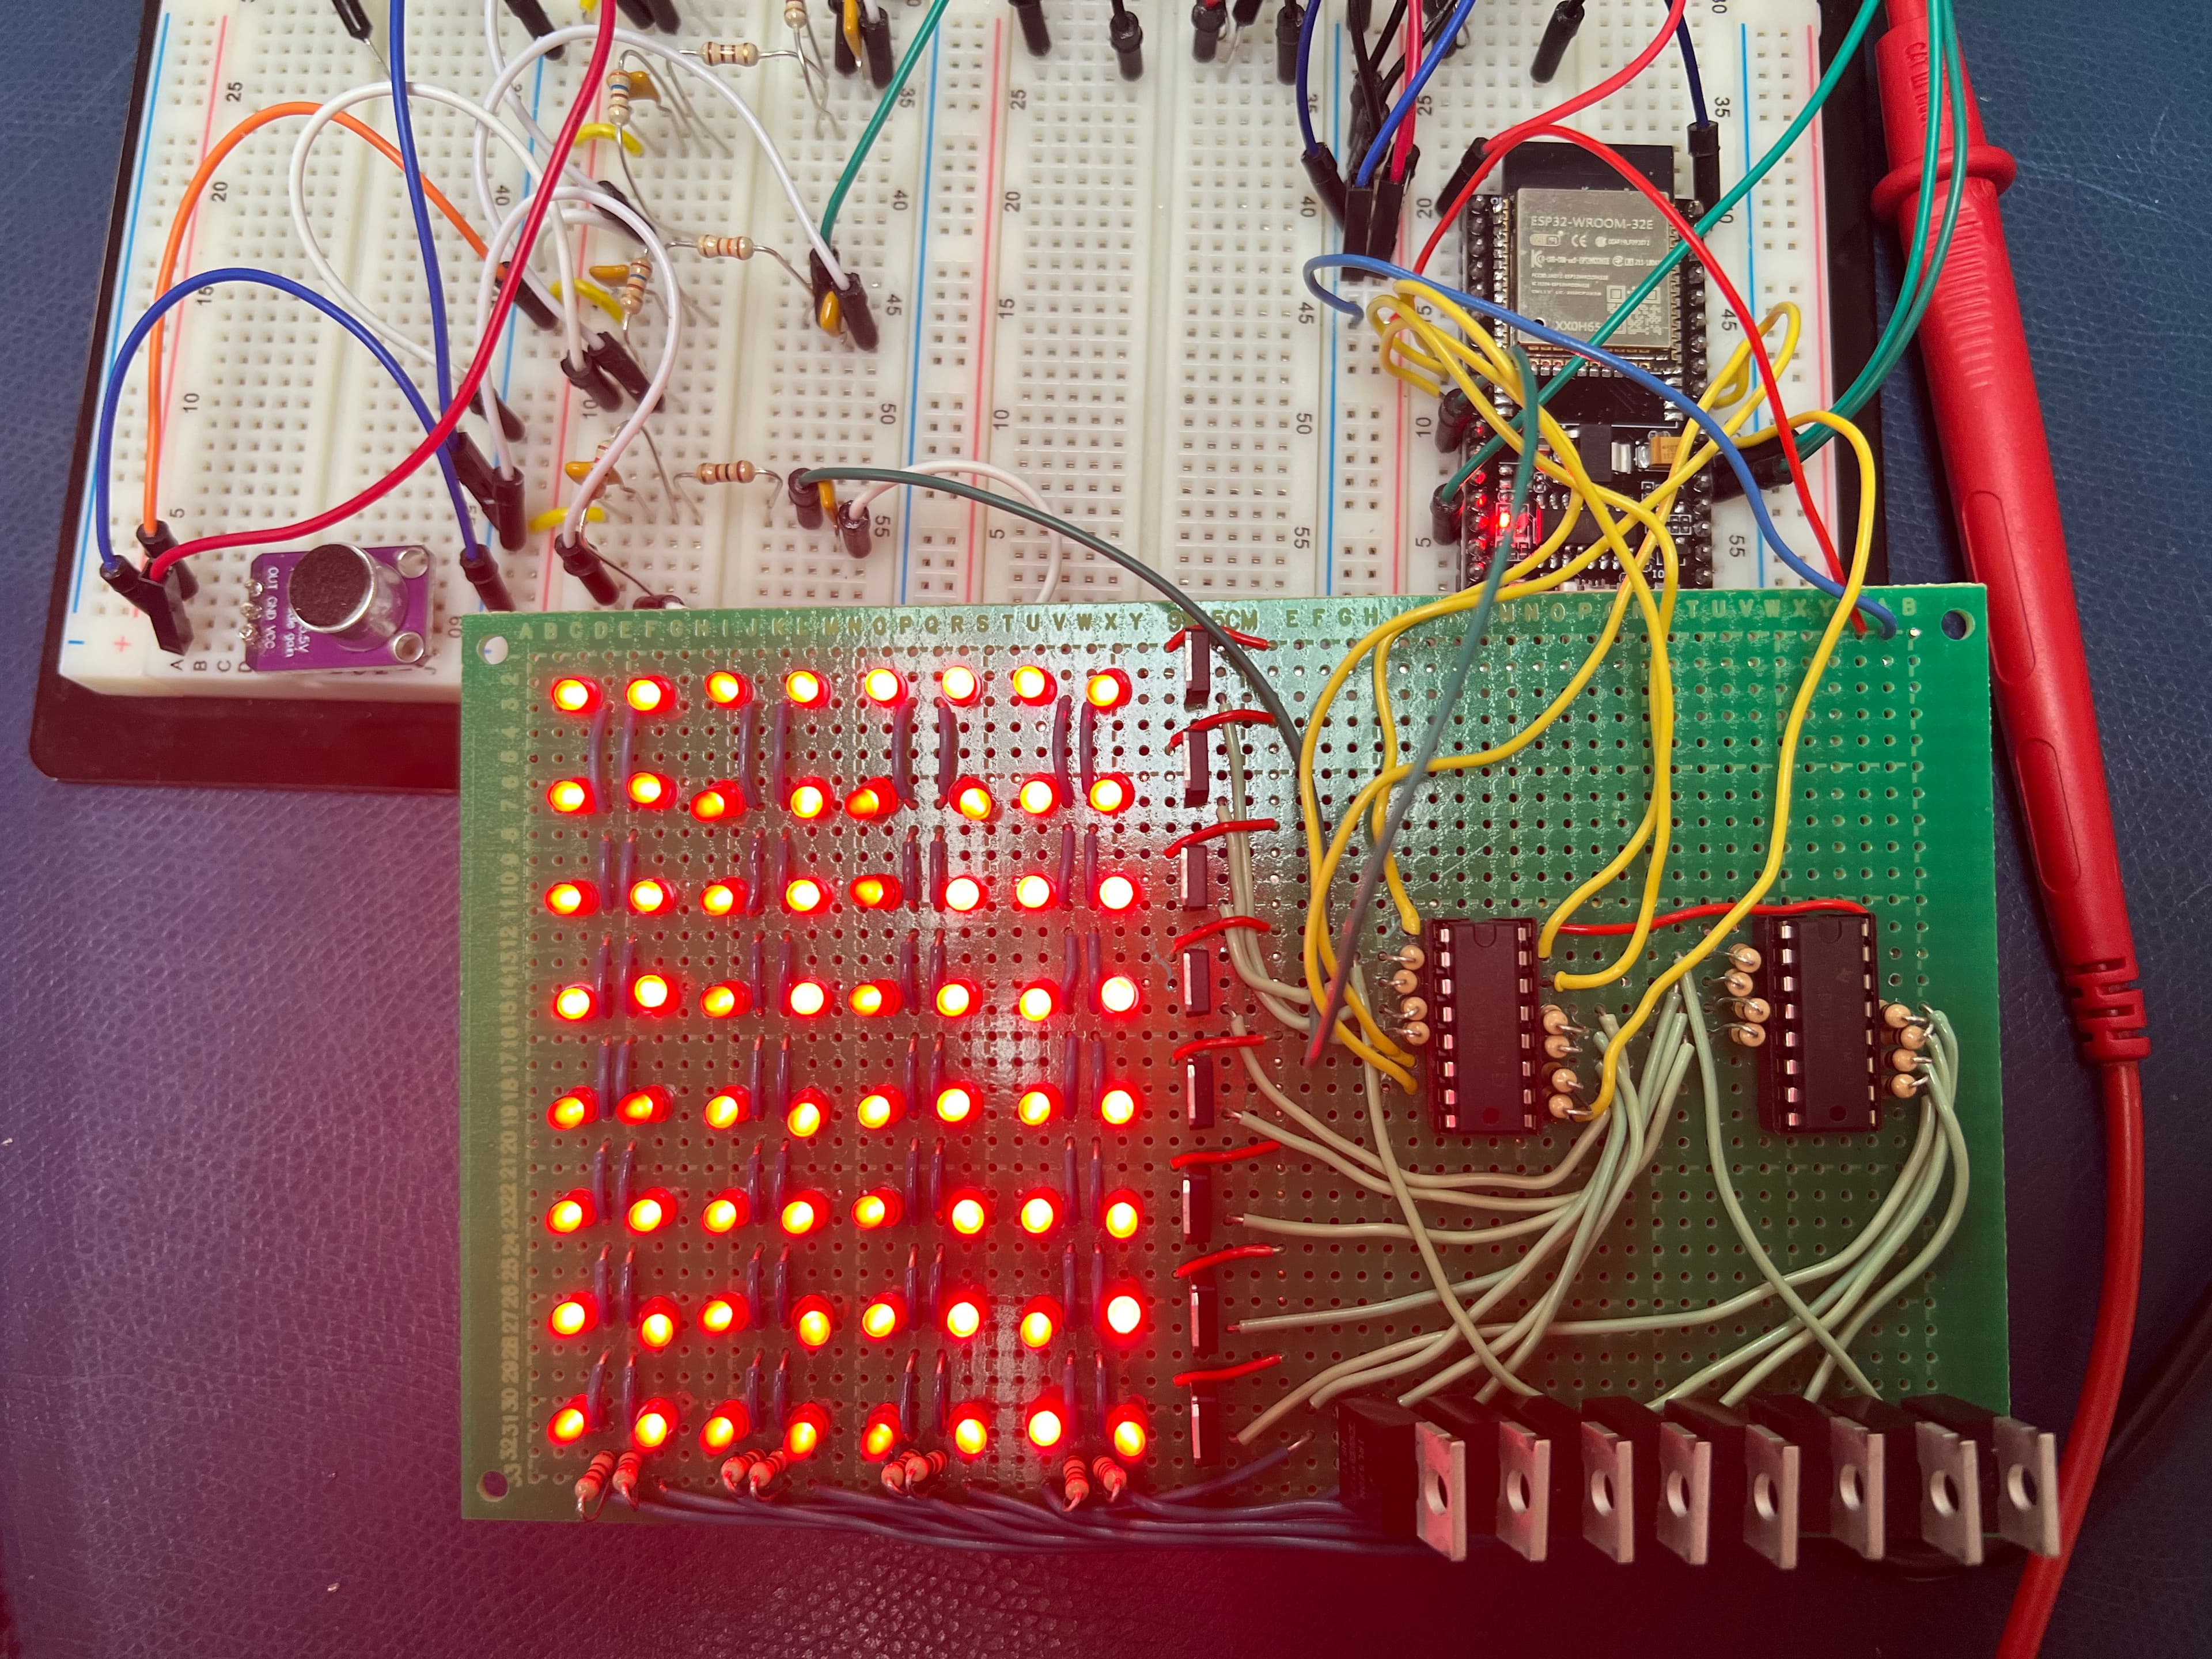
Display — the four filter outputs were read by ESP32 ADC pins and displayed on a hand-soldered 8x8 protoboard LED matrix. Two shift registers controlled the rows and columns through pMOS and nMOS transistors, while a timer rapidly updated the display to prevent visible flickering.
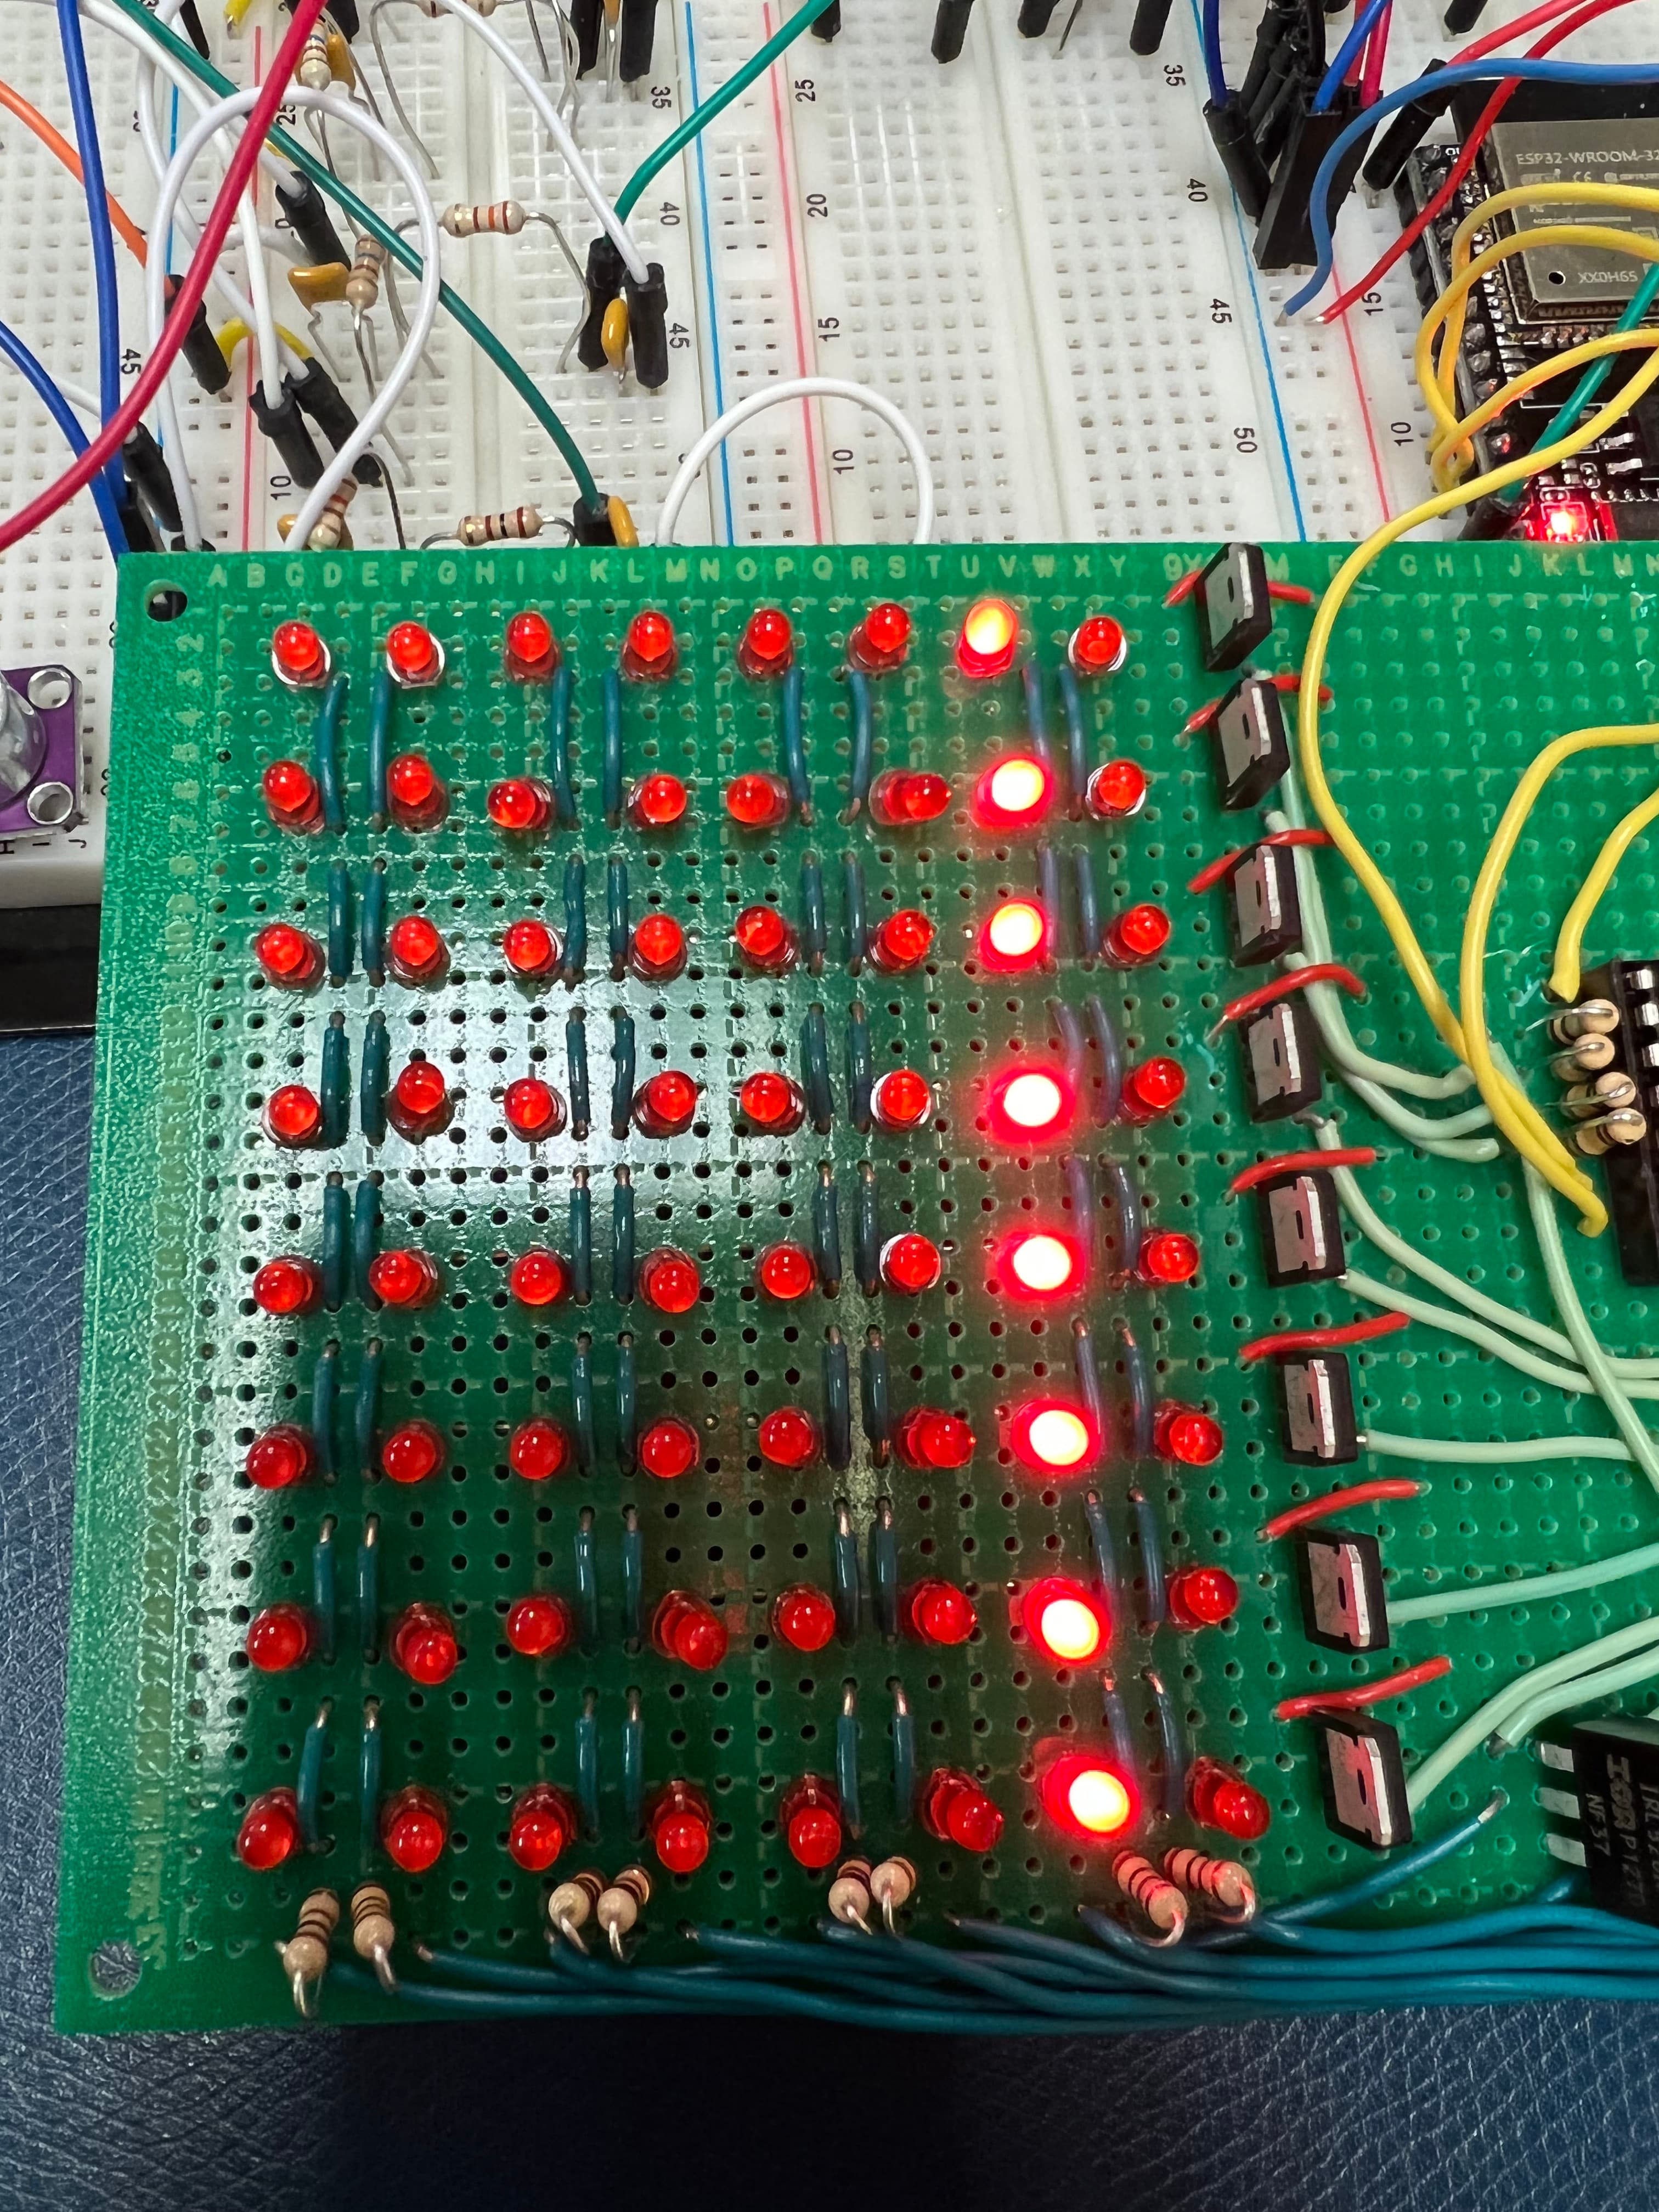
Each channel was averaged over 50 samples to smooth out noise. The resulting values were scaled to the height of the LED matrix, creating a live bar graph with one pair of columns for each frequency band.
Debugging
The reversed filters: In the filter stage, the four band-pass filters didn't behave correctly at first. The root cause was that the high-pass and low-pass stages within a filter had been built in the wrong order. Every component value was correct, but the sequencing wasn't, which broke the intended frequency response. Swapping the order fixed it.
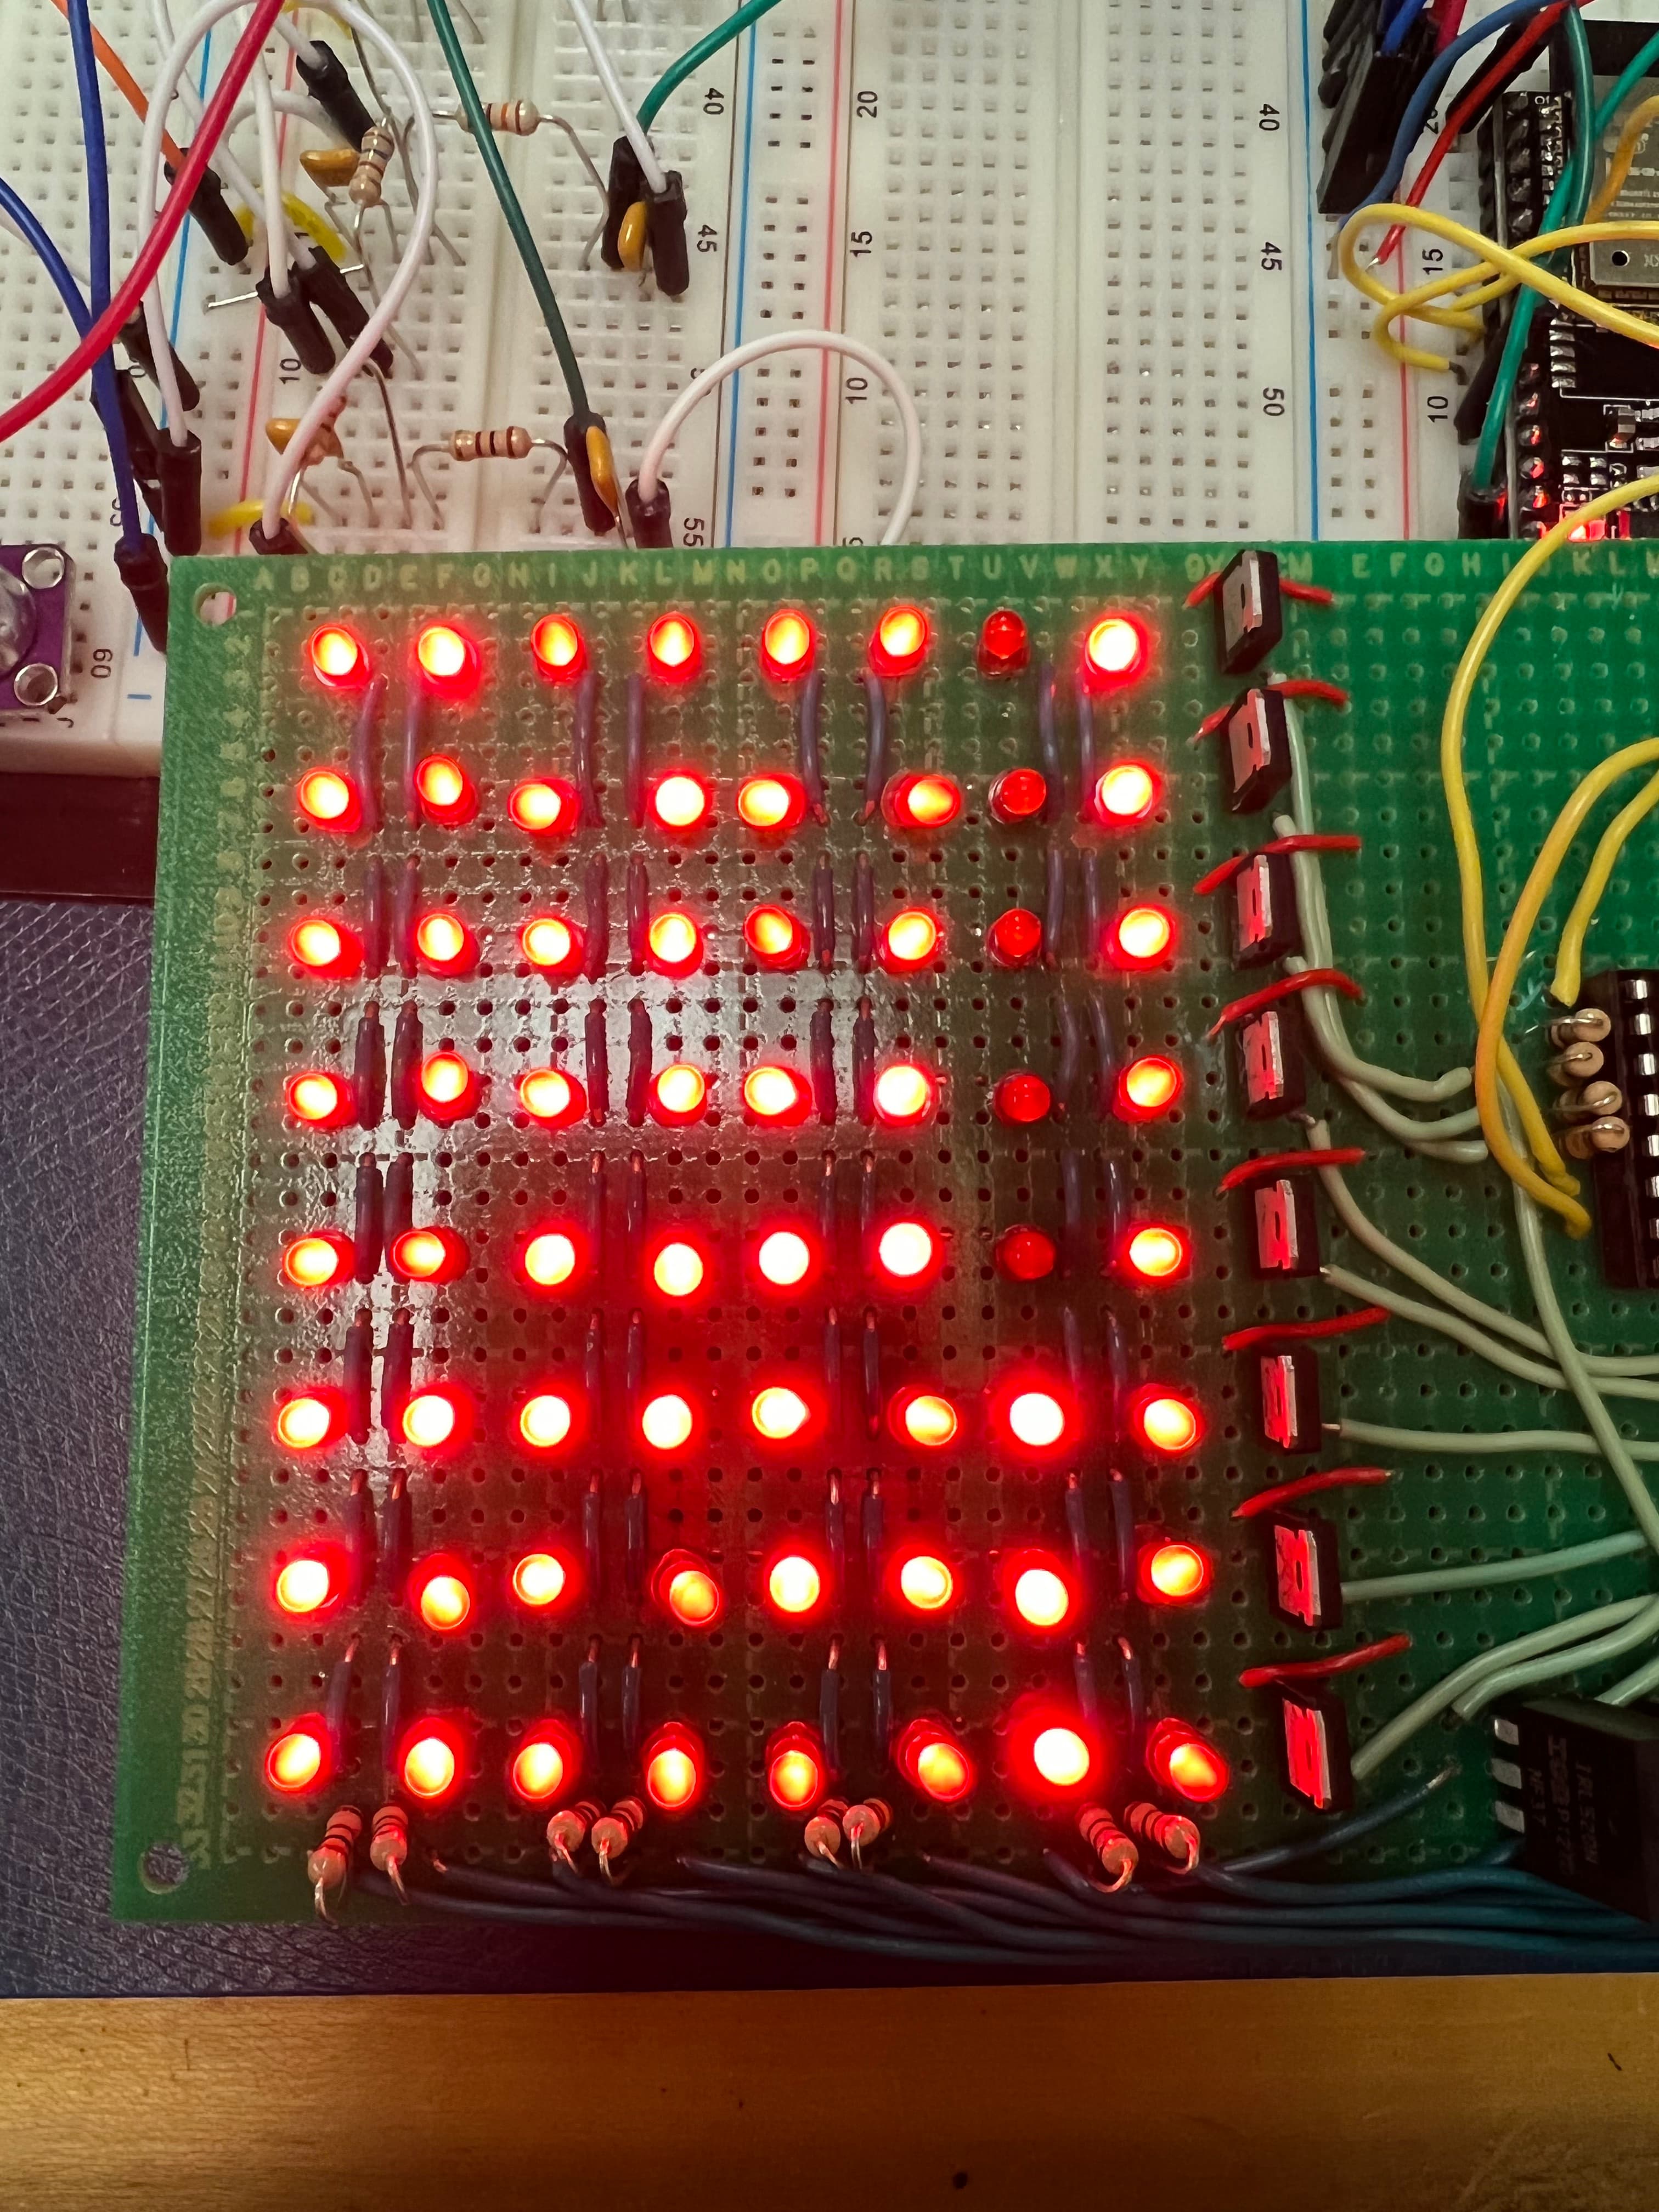
The LED matrix displaying incorrectly: In the display stage, the LED matrix wasn't showing the correct pattern and isolating whether the fault was in the firmware (row/column shifting logic, timer configuration) or the hand-soldered hardware (64 LEDs, two shift registers, and the pMOS/nMOS driver transistors) was the hardest part of getting the display running.
I isolated it as a hardware issue by visually inspecting which rows and columns actually lit for each shift-register state and tracing that behavior back to the specific driver transistor responsible — pMOS transistors sourcing each column, nMOS transistors sinking each row. Working from that expected row/column behavior, I checked and reworked individual solder joints and transistor placements one at a time, iterating until every LED in the matrix lit correctly.
Verification
Each stage was checked before the full system was integrated. The ADC inputs were verified first with an oscilloscope trace and the Arduino Serial Plotter, confirming the ADC tracked a known voltage before any analog filters got involved. I then used a signal generator to sweep a 10 Hz to 5 kHz signal and measure their actual frequency ranges and overlap. Lastly, I tested the system using real audio from the microphone.
Results
The finished system splits a live microphone signal into four analog frequency bands and displays their relative energy in real time on a custom 8×8 LED matrix built from discrete LEDs, shift registers, and driver transistors.
What I'd do differently
The measured filter bands overlapped noticeably more than the first-order RC calculation predicted, and the microphone itself was noisy enough to shift the whole signal baseline. I would try this project again with higher-order filters or a better microphone. The 50-sample averaging that smooths the display was also the part I understood least well. I got it working by tuning the numbers until the display looked right, rather than fully deriving the math behind it, which is worth doing next time.